

Housing Stock: A Closer Look
charleston’s housing stock
In the past 10 years, a 13% population increase in the City of Charleston and 20.18% population increase in the tri-county region -- and the resulting demand for housing -- has driven a substantial increase in new residential construction. Since 2014, the City of Charleston has averaged 3.5% new units permitted annually, a whole percentage point higher than other fast growing areas like Austin, Seattle and Denver. Charleston averaged 1.6% new households moving to the city annually over the same period according to the American Community Survey.
Despite a steadily growing housing supply, we know from the previous analysis (See “Understanding Affordability”) that 42% of all City of Charleston households are cost-burdened, meaning they are spending more than 30% of their annual income on housing costs. To improve our understanding of affordability in terms of housing cost, we contracted with Community Data Platforms to help us take a closer look at our existing housing stock compared with household incomes across the city.
In the interactive visual below, the findings help us answer the questions:
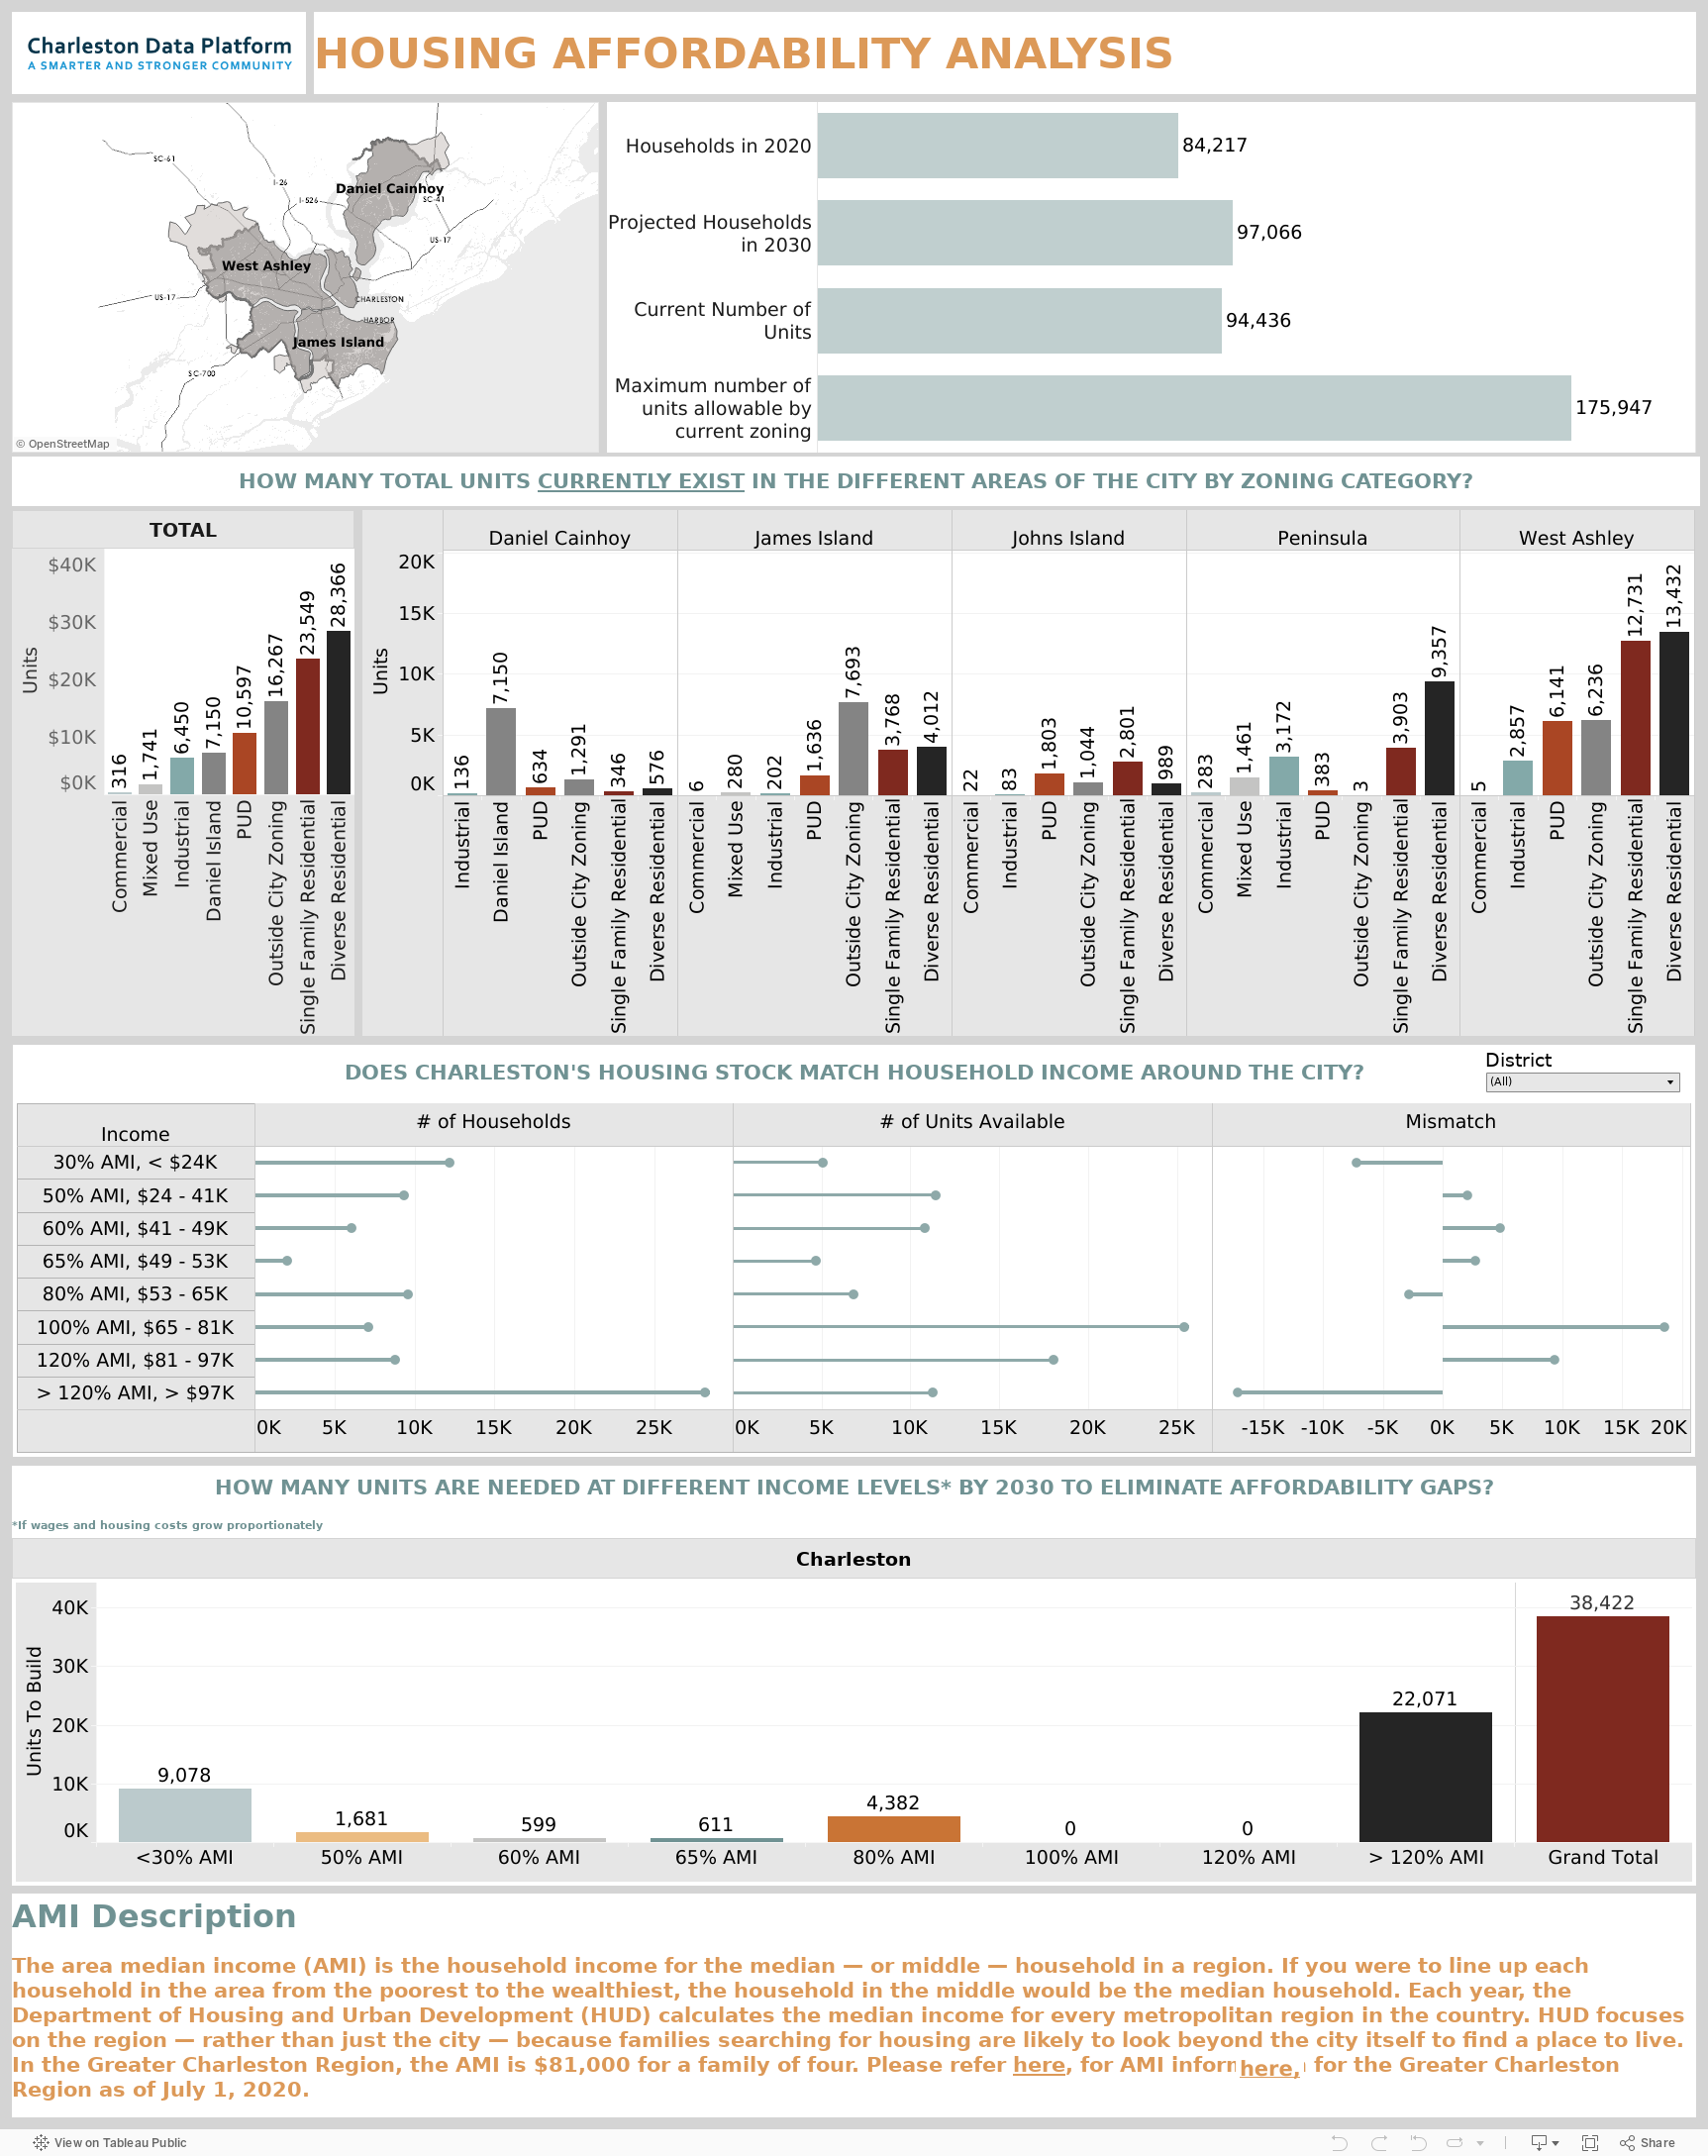
How many households are there now and how many are there projected to be by 2030?
What is the current number of housing units and what is the maximum number of allowable units (based on current zoning densities)?
How is our housing stock distributed across the city and by zoning category?
How well does our housing stock meet housing needs, in terms of housing costs and household incomes?
What would it take to close affordability gaps by 2030, factoring in population growth?
Before you dive into the data, here are some important things to keep in mind.
Units vs. Households: The term “unit” can include a single-family home or an apartment, where a household resides. The term “household” refers to the individual or group of individuals that occupy a single unit. It is normal for there to be more units than households in a city, especially in cities where many units are used as second homes or vacation rentals. The vacancy rate (percent of unoccupied units) in the City of Charleston is 9.6% (source: Community Data Platforms), compared with 18% in Charleston County and 8.6% for the U.S. average (source: American Community Survey).
Units allowable by current zoning: Every zoning classification in the City sets a maximum residential density (# of units per acre) for the parcel that is zoned. Not all parcels are built out to maximum density - in fact most aren’t. There are many other factors that can limit density on any given site, including individual property owner preference, natural features of the landscape (water bodies, marsh and wetlands), and other zoning regulations that limit things such as how far away from the property lines a structure can be erected, how much of the lot can be covered by building and which trees can be removed. We included the “maximum number of units allowable by current zoning” to provide insight into how efficiently our current allowable densities are being used.
Housing stock vs. available housing: This analysis looks at simply what exists, not necessarily what is available. Availability is influenced by a whole range of factors, including housing choice. The purpose of the analysis is to give us a comprehensive picture of our existing housing stock and where are the biggest gaps in terms of cost, but it is only one layer of a highly complex and fluid situation — one which will require a variety of strategies to address.
Affordable housing: For the purposes of this analysis, affordable housing includes all housing affordable to households making from 0% to 120% of the Area Median Income ($81,000 for a family of four). The federal Department of Housing and Urban Development (HUD) considers housing affordable if the household spends no more than 30% of their annual income on housing costs. Of the 76,219 affordable units in the City of Charleston, 5,233 (6.87%) are formally dedicated as low-income and workforce housing, meaning the housing costs are subsidized through federal, state and/or local (private and public) funding sources and residents must meet income eligibility requirements to purchase or rent. In the last 20 years, combined public and private efforts to provide more dedicated affordable housing have generated or preserved on average 94 new units each year.
Units needed by 2030: The figures presented assume that housing costs and income will rise at rates proportional to today between now and 2030. However, building new affordably-priced units isn’t the only way to close the affordability gap. The mismatch in housing costs and incomes could also be addressed by an increase in incomes or by existing housing stock becoming more affordable.
How to interact with the data:
If you’re having trouble viewing the full image, use the bar at the bottom of your screen to scroll to the right, or click on the 3 dots in the top right corner of your window (in Chrome) and click the (-) to zoom out.
In the first row, click on different areas of the map to see different results in the bar graph on the right.
In the third row titled “Does Charleston’s Housing Stock Match Household Income Around the City,” click the arrow on the drop-down menu on the top right corner under “District” to view different results by area of the city.
Hover your mouse over bars to see totals and other information.
Questions about the data? Contact us at cityplan@charleston-sc.gov

The ‘mismatch’ graphic above shows us where there are deficits in existing housing stock. The illustration to the left shows what can happen when there is not enough price-appropriate housing to meet the needs of residents. Limited supply for one income bracket can create a ripple effect, limiting supply for other income brackets. This pressure can come from any direction.
Stay tuned for more findings from our Land Use and Water Analysis.
Learn more about this and other topics we’ll be addressing in the plan by visiting the Explore tab.