

explore the data,
understand the city

Background
The City Plan is required by the State of South Carolina. It is developed by the Planning Commission and adopted by City Council. The Plan is revised every ten years and updated every five years. The Century V Plan was completed in 2010.
The City Plan will guide the growth of areas within the City of Charleston – not the wider region or neighboring jurisdictions outside of the Urban Growth Boundary.


Recent Trends
Over the last ten years, Charleston has seen economic growth and an increase in population. These changes have had positive and negative effects on our community. To meet the challenges we face, we will need to address issues associated with cost of living increases, transportation system growth, and a loss of diversity.

charleston’s population
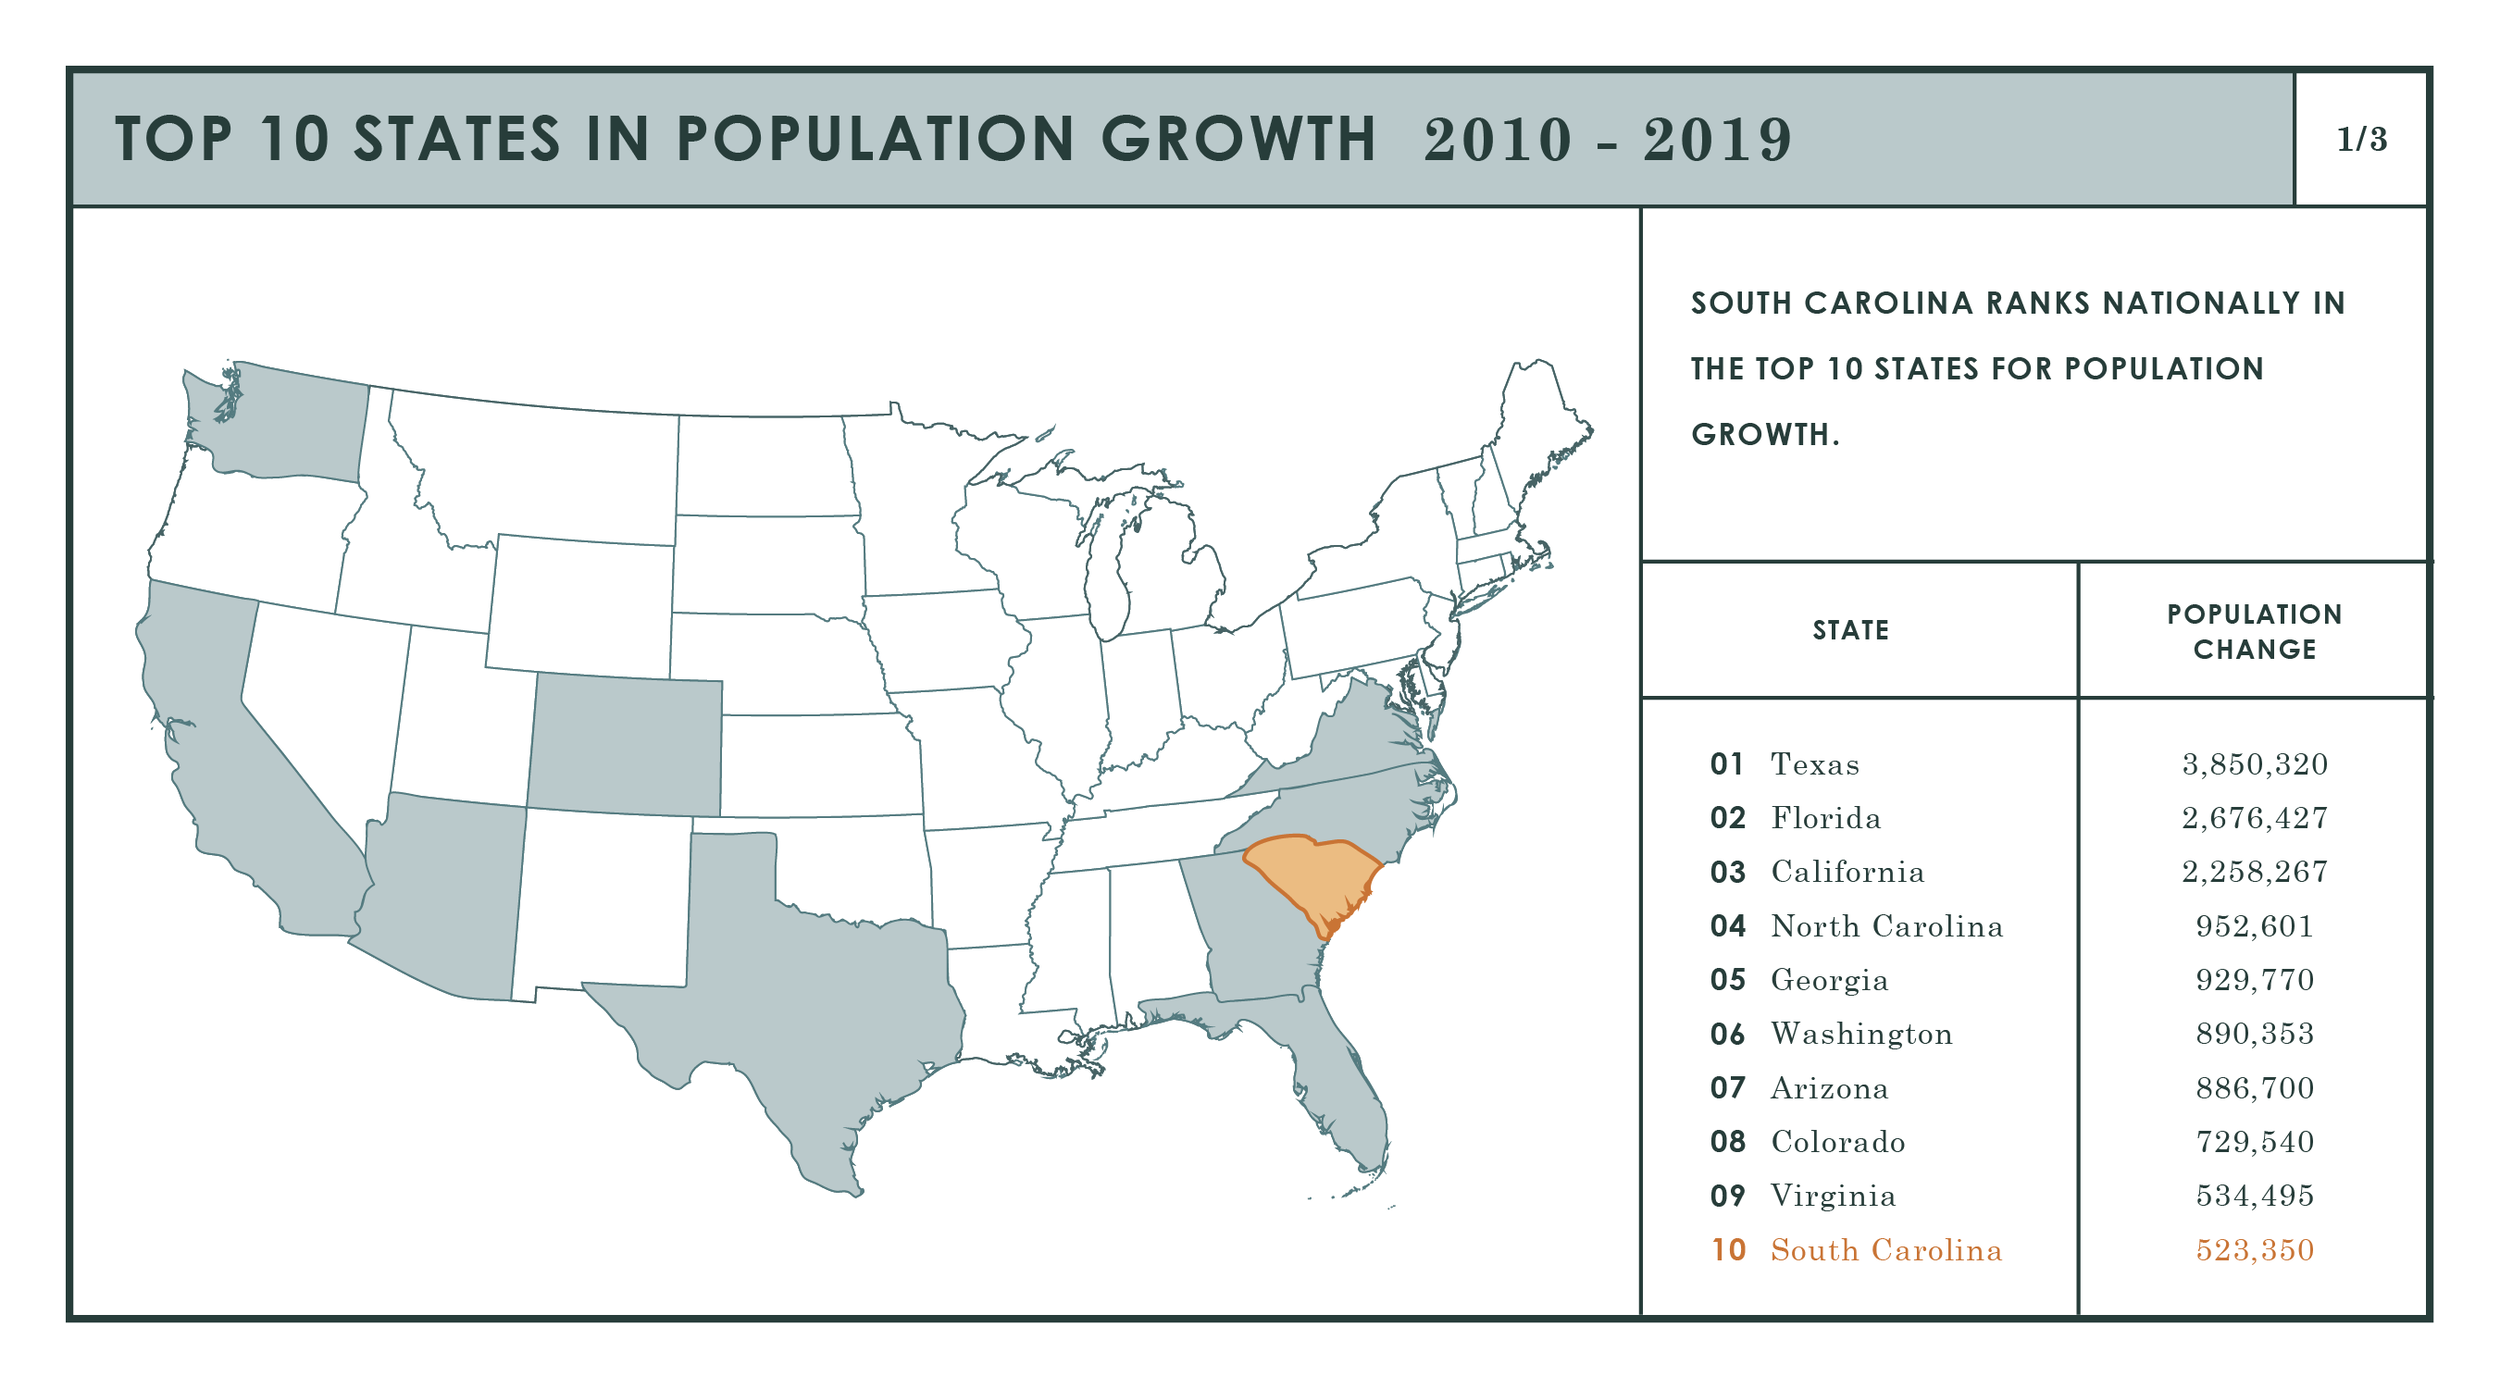
Population of Coastal Southeastern states increased over the past ten years.
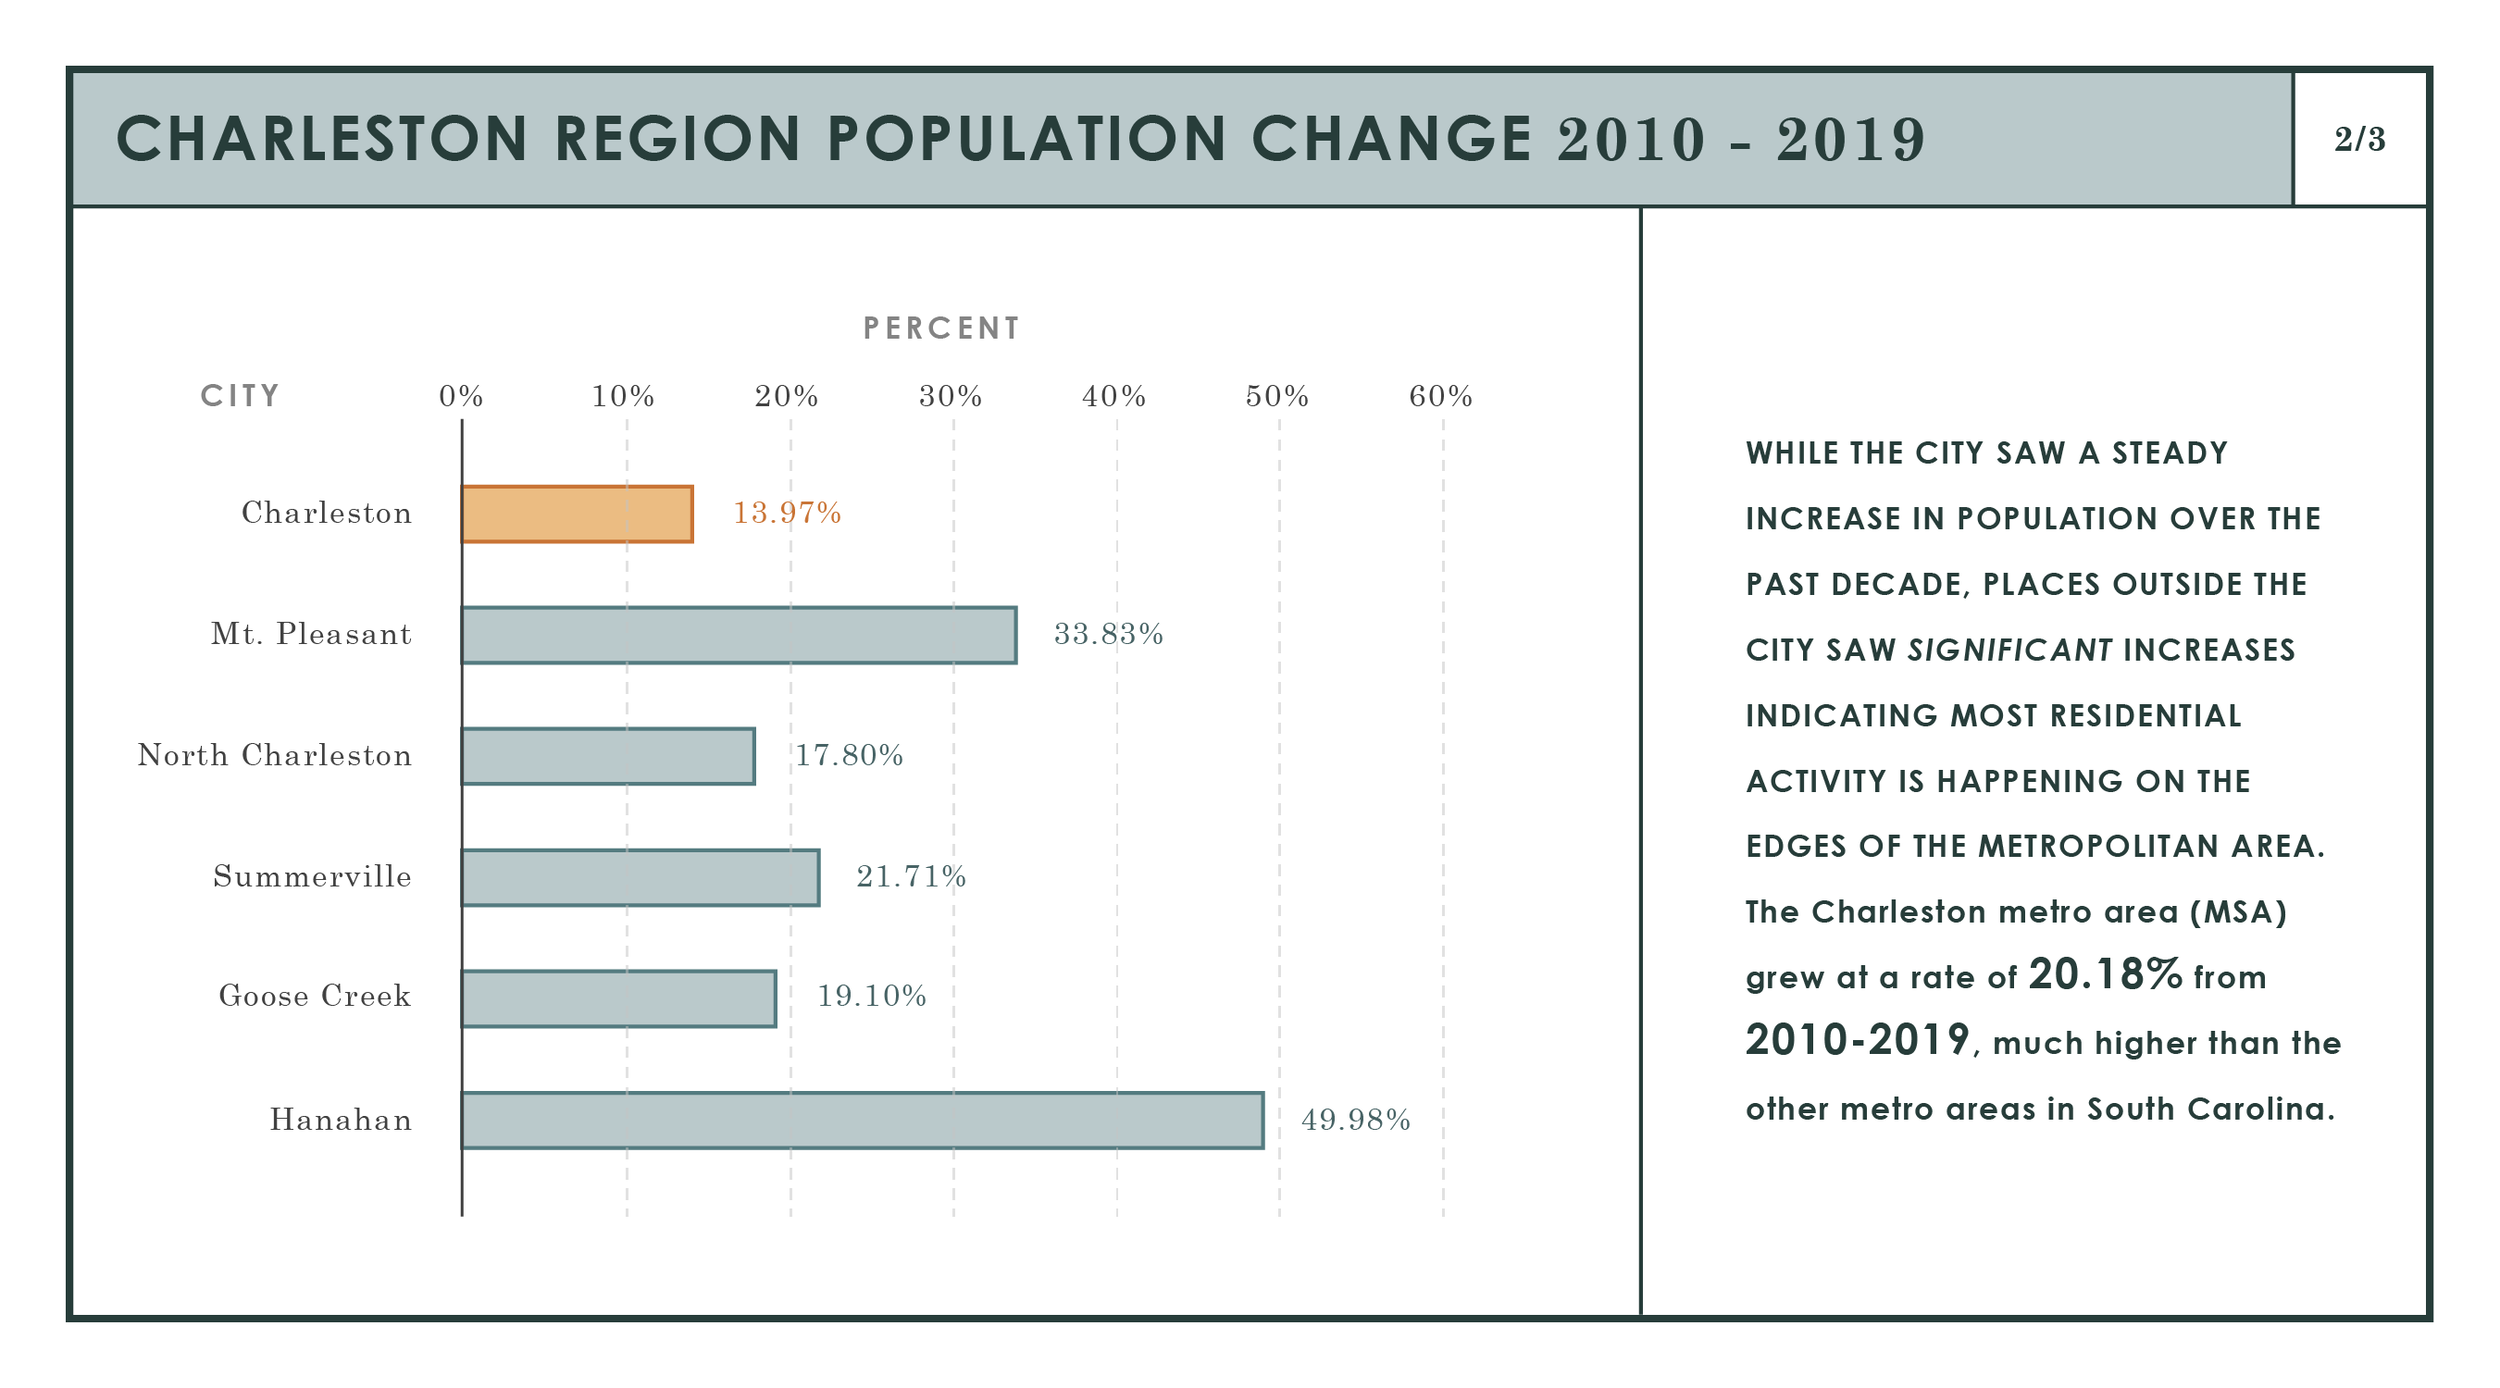
While the Charleston region as a whole increased in population, our city experienced the least change in population of the six largest metropolitan areas in the region. The City of Charleston’s population has consistently increased since 1980, with the greatest increase occurring in the last decade.
Scroll below to learn more about how Charleston has grown over the past ten years.

Our regional economy is growing.
The increase in new jobs has played a significant role in bringing new people to the Charleston area.


where charleston lives
All parts of the City saw an increase of new residents, but Johns Island and the Cainhoy Peninsula area experienced the largest percent increases in population between 2010 and 2020.
To accommodate housing demand generated by new residents, the City permitted about 19,000 new residential units over the past 10 years. During this time, West Ashley received the highest number of units at about 6,500, while James Island saw the lowest number with about 2,000 units. Reversing a multi-decade trend of little to no residential growth, the Peninsula saw about 3,500 new residential units.
click image to enlarge

how our city moves
As the population has risen in our region, most community members choose to use personal automobiles with 82% of commuters driving alone in a vehicle. Less than 6% of commuters walk, bike or use transit.*
There have been investments in multi-use trails, bicycle lanes, and park and ride facilities. Further investing and encouraging alternative means of transportation will help reduce automobile traffic. Notable future investments include the HOP park and ride shuttle, Ashley River Crossing bike and pedestrian bridge, Lowcounty Rapid Transit system, and improvements to I526.
*(Source: 2018 American Community Survey)

The problem with popularity
Over the last decade, Charleston has received numerous accolades for its tourism, job creation, and livability.
However, Charleston also ranks high in cost of living. In the Southeast region, Charleston comes in second to Washington, DC, where median household income is 28% higher.*
High housing costs contributes to an overall higher cost of living as compared to other metropolitan areas in the region.
*(Source: 2018 American Community Survey)


Read more about findings from the housing analysis and charleston’s housing affordability challenge on the city plan blog.
Charleston is losing racial diversity.
High costs of living combined with income disparities make it harder for long-time black residents to stay. The most notable loss of black households has been on the Peninsula and Johns Island.


Water
As evidenced in recent years, Charleston faces growth pressure in the built environment and climate changes in the natural environment requiring adaptation to preserve, maintain and thrive. Adaptation planning for the impacts of sea level rise and extreme weather events requires a thoughtful look to the future using the best science and most recent data available upon which the City Plan will rely as a basis for its recommendations.
Tides
It is clear from historic tide data Charleston saw an increase in the frequency of high tide flooding events from 1980 to 2019. During that time, Charleston went from 9 high tide flooding events in the 1980’s to 42 events in the 2010’s. This explains the frequency with which we are getting more “sunny day” or nuisance flooding in certain places throughout Charleston.

The data presented in the total annual flood events graph show the number of high tide measurements above 7 feet (about 2 ft above the daily average high tide) in Charleston Harbor per year. A tide above 7 feet in Charleston typically means water begins spilling into roadways, inundating stormdrains and sometimes flooding structures at lower elevations.
Source: National Oceanic and Atmospheric Administration (NOAA): Charleston, SC Coastal Flood Event Database
What is High Tide Flooding?
A high tide flood event typically occurs when ocean waters reach 1.75 to 2.0 feet above mean higher high water (MHHW) tidal datum. In Charleston Harbor the high tide flood event threshold is 7.0 ft.
This is a confusing and challenging concept to explain. To help, our GIS team created this website that helps explain the difference between the tide (MLLW) and ground elevations (NAVD88). http://gis.charleston-sc.gov/tideeye/how-high-is-that-seawall/
Sea Level Rise
The Charleston Harbor tide gauge has been measuring sea level continuously since 1921. In that nearly 100-year time span, local sea level has risen 1.07 feet.
Since 2010, the harbor has risen by 14.1 millimeters (0.56 inches).

Explore the map below to view sea level rise forecasts based on predictions from our nation’s lead scientists. The map shows elevation changes throughout the city and where we can expect water to be at the average daily high tide in 2030 and beyond.
This Sea Level Rise Map Viewer is an indicator of how flood risk is inextricably linked to elevation by showing the lowest lying areas of Charleston as the greatest risk of flooding by storm surge and high tides. While elevation is a factor for determining flood risk, there are several other factors contributing to flooding such as storm precipitation rates, stormwater run-off rates or natural/artificial physical barriers to drainage.
Use the scroll function your mouse to zoom in and out, or the + and – buttons on the map, and adjust the slider in the toolbox on the right to show predicted sea level rise by year.
Storm Frequency and Severity
While it is increasingly clear that climate change has influenced water-related variables that contribute to flooding, sea level rise is only one factor. In addition to tidal flooding and sea level rise, recent data indicates changes in national precipitation trends are occurring. Rain events have a profound effect on public safety, economic viability, and overall quality of life. Data presented in the NCA4 indicate that precipitation has increased in frequency and project that current climate trends will continue to increase extreme weather events for this region.
Read more about findings from the city plan land and water analysis on the city plan blog.
Dive deeper (pun intended) and check out these helpful resources from the City’s GIS team:
Living With Water: City of Charleston Map History Tour
How High is that Seawall? Understanding Elevation and Tides in Charleston

Get involved
We need a new plan to guide our City toward a more resilient and equitable future - and we need your help.